The Business Value of Speed - A How-To Guide - Part 2: Metrics and mapping of Business Values
Update (October 2025): This post was originally published in July 2020. In March 2024, Google replaced First Input Delay (FID) with Interaction to Next Paint (INP) as a Core Web Vital. This update reflects those changes with INP replacing FID throughout. The methodology for mapping performance metrics to business values remains valid and effective. Code examples have been updated to use web-vitals v4 API (
onCLS,onINP,onLCP).
Last week I wrote the first post of this series. In this part, I want to show you a simple method to measure essential performance metrics and map them to standard business metrics.
The first post covers the details of the Critical Rendering Path and therefore explains the sequence of steps to the first pixel. If you haven't read the first part, I recommend you to do so.
I publish one post of the series a week, so stay tuned for the next three weeks.
- Week 1: Critical Rendering Path
- Week 2: Measure Key Metrics and map them to Business Metrics
- Week 3: Optimizing for your Business value
Tldr;
This post is the second of the series about how to get the business value of site speed. In this part, we dive into standard and custom metrics and map them to common business metrics like conversion or bounce rate.
Table of Contents
1. Introduction
If you ever had a sales or marketing role in your career, you might know the two sweet words: closed-won. Closed-won means that the purchase has been made. We all aim for more closed-won. Probably we have different names for it, but the core stays the same.
We also know that faster === better. That's simple. Faster sites have better results. But this is useless to us if we do not have any useful mapping. Therefore we want to know, "How much faster and how much better". To archive this, we need to map our performance metrics to business metrics. Surprisingly this is much simpler as it sounds.
If you have an online shop, a blog or any other online business, you probably already measure some of these metrics: The conversion rate of your newsletter subscription or your excellent product you sell in your shop. In this post, I show you some essential metrics you should measure and how you can map them to your business metrics.
With these reports, you can talk about performance on the manager level. Your stakeholder probably isn't interested in the number of third party request, the total blocking time of the main thread or number of unused CSS selectors.
But stakeholders are interested in the possibility of an increased conversion rate, and they are interested in higher revenue. No matter what it is, that makes you read this article, if you have your own online business or if you want to convince your boss, the following steps can help you to establish a performance culture and make your business better.
Collect the nessessary data
When you run Google Lighthouse in your browser, you get a good overview of how your site performs in a particular environment. Like in a lab. The data you get is excellent to make improvements on your site when you already know where you want to optimize your website.
But for the Business Value of Speed, we need data from the field. This method of collecting data is called Real User Monitoring or pure RUM. Whereas Lighthouse measures the data on your computer, with your network connection RUM collects the data from real users.
There are plenty of great tools you can use, but most of them are quite expensive to set up. Fortunately, there are some alternatives that you can use for free or with a minimum of costs. In this article, I use Plausible Analytics and some client-side scripts to show you a free method to collect field data.
Before we dive into the measurement, let's take a look onto the metrics.
Metrics
In the first part, I wrote much about the Critical Rendering Path, and it's a sequence of steps until to user sees something or can interact with the page. Modern browsers give us the possibility to make the timings visible with the Navigation Timing API. Check out all supported browsers.
Navigation Timing API
If your browser supports the Navigation Timing API, you can view the results in the console tab of the Chrome Dev Tools. Copy and paste the following snippet window.performance.timing to your console and hit enter. You get the PerformanceTiming Object like the one below. It has multiple entries with a Unix timestamp.
PerformanceTiming {
navigationStart: 1595247273900,
unloadEventStart: 0,
unloadEventEnd: 0,
redirectStart: 0,
redirectEnd: 0,
connectEnd: 1595247273906
connectStart: 1595247273906
domComplete: 1595247274786
domContentLoadedEventEnd: 1595247274333
domContentLoadedEventStart: 1595247274317
domInteractive: 1595247274203
domLoading: 1595247273922
domainLookupEnd: 1595247273906
domainLookupStart: 1595247273906
fetchStart: 1595247273906
loadEventEnd: 1595247274789
loadEventStart: 1595247274786
navigationStart: 1595247273900
redirectEnd: 0
redirectStart: 0
requestStart: 1595247273910
responseEnd: 1595247273911
responseStart: 1595247273911
secureConnectionStart: 0
unloadEventEnd: 0
unloadEventStart: 0
...
With this PerformanceTiming object, you can measure most of your technical performance metrics. Assuming that we are using Plausible Analytics, it is even more straightforward.
The Web Vitals and custom metrics
Not all businesses are equal. If you have a session time of more than 40 minutes, you probably need custom metrics. Additionally, some of the parameters you can collect are more important than others. Google introduced Web Vitals. I wrote a blog post about them and why you should measure them. The Core Web Vitals subset cover three fields of web performance shown in three metrics and their thresholds.
- Largest Contentful Paint (LCP)
The LCP measures loading performance. Your LCP should occur within 2.5 seconds of when the page first starts loading.
- Interaction to Next Paint (INP)
INP measures interactivity and responsiveness. Pages should have an INP of less than 200 milliseconds. INP replaced First Input Delay (FID) in March 2024 because it provides a more complete picture of page responsiveness by observing all interactions throughout the page lifecycle.
- Cumulative Layout Shift (CLS)
CLS measures visual stability. Pages should maintain a CLS of less than 0.1.
The following code examples show how to send your metrics to Plausible Analytics.
import {onCLS, onINP, onLCP} from 'web-vitals'

function sendToPlausible({name, delta, id}) {
  plausible(name, {
    props: {
        duration: Math.round(name === 'CLS' ? delta * 1000 : delta)
    }
  });
}

onCLS(sendToPlausible)
onINP(sendToPlausible)
onLCP(sendToPlausible)
What if you need a custom metric? This could be "Time to first click", "Frames per second after click" and other timing metrics that describe your users experience the best. While we are working with Plausible, you can send an event like the Web Vitals event above to measure the timings. In my case, I measure the following metrics among some others.
dns: timing.domainLookupEnd - timing.domainLookupStart
connect: timing.connectEnd - timing.connectStart
basePage: timing.responseEnd - timing.responseStart
frontEnd: timing.loadEventStart - timing.responseEnd
As you see, measuring field data isn't very hard to do. If you want to dive a bit deeper into the field data and use a more sophisticated tool, I recommend you to take a look at the open source tool boomerang and Parfume.js. The latter is a wrapper around the Navigation Timing API that I use on my website.
Furthermore, you find a detailed installation guide how to implement boomerang with boomcatch and some data visualisation tool.
Newsletter
Hello and welcome! Get insights on system architecture, technical leadership, and building scalable digital products delivered directly to your inbox. Learn from 13 years of experience designing solutions for enterprises and startups. Sign up now for practical expertise on system design, performance optimization, and full-stack development!
3. Mapping Business Values to Performance metrics
Now let's get it started! Mapping business values to performance metrics. In this case, I use Plausible to show you the correlation between the Page Load and the Conversion Rate. We do this by setting up a custom goal in Plausible.
- Create a Custom Goal
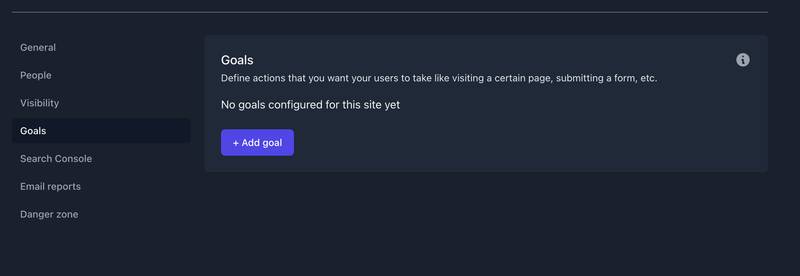
Navigate to your website's settings in your Plausible account and visit the "Goals" section.

Select Custom event as the goal trigger and enter the name of the custom event you are triggering. The name must match the one you are using in your code. In my case, it is LCP.

- Navigate to you Plausible dashboard. At the bottom of the page, you can see the custom goal section.

Now, if you click on one goal, you get all details, a summery of the value you measured, and all single events. Additionally, you the whole dashboard filters for this goal to let you see the correlation between the goal and other metrics.
Calculate the revenue
If you want more and if you have access to all of your data, you could even make a proof of concept and calculate the revenue you had due to performance optimizations or make some assumptions for future performance improvements. How can you do this? web.dev provides a step by step guide how to calculate your revenue.
4. What about causality?
You always have to keep in mind that "Correlation does not imply causation!". There are still other effects that can mess up your data. And of course, If you want to know more about that reach out to me.
5. Conclution
Where are we now? In the last part of my series, you read much about the Critical Rendering Path and what the browser needs to do before it can display your site. In this part, we talked about the relevant metrics and how you can map them to business values in Plausible. You probably can do this as well with other analytics tools. All you need to do is to measure the timings and the business metrics per session.
In part three, I write about simple and complex optimizations for the Critical Rendering Path and your key metrics. I publish part three next week, so stay tuned.
6. Next steps
You find all the resources for this article on GitHub. Feel free to check it out, try some stuff or fork it.
Now you have an understanding of how you Business values can map to performance metrics.
If you like this article, smile for a moment, share it, follow me, check out my RSS feed and subscribe to my newsletter.
Cheers Marc
Further Reading
- web.dev: Value of Speed
- Buddy Brewer :: Taking the Guesswork out of Performance Budgets :: #PerfMatters Conference 2019
- The Impact of Web Performance
- The Business Value of Site Speed — And How to Analyze it Step by Step
- GitHub boomerang
- A Low Cost Performance Monitoring Setup with Boomerang, Boomcatch, and Datadog